Registration is closed
Are you interested in this course?
Please fill in the form below, and we will let you know as soon as the next edition is announced.
You can also use this form to request this as an in-house course for your group.


Live Online Course – 3rd Edition
January 6th, 8th, 13th, and 15th, 2026
Contact: courses@transmittingscience.com
Click on the image to glance through the previous edition
Are you interested in this course?
Please fill in the form below, and we will let you know as soon as the next edition is announced.
You can also use this form to request this as an in-house course for your group.
Click here to express interest in this course
Analyses of morphological disparity provide unique insights into evolutionary history, quantifying the anatomical variety of clades and its fluctuation through time. This course will provide an in-depth overview of the different types of data and methods that underpin these analyses and give participants the necessary skills and understanding to apply them to their own research questions.
Across four days, we will cover the advantages and disadvantages of different types of morphological data, the differences between different types of morphospaces, the range of distance metrics than can be used to measure intertaxon dissimilarity, and how ordination methods can be used to reduce dataset dimensionality and identify patterns.
Contemporary methods for visualising, quantifying, and interpreting patterns in disparity will be covered at length, as will the theory underpinning data ordination, generalized Procrustes analysis, and Fourier shape analysis, both traditional and elliptical. Additionally, we will discuss how simulations can be used to fit models of evolution to empirical data and disentangle genuine evolutionary phenomena from artefacts of sampling and experimental design.
How different types of morphological data are collected will be discussed but will not be included in the practical component of the course.
We will provide a selection of model datasets for participants to use during the practical components of the course. However, we encourage attendees to bring their own datasets so that they can gain experience tailoring the techniques this course will introduce to their own analytical needs right away.
Places are limited to 18 participants.
Graduate or postgraduate degree in Life or Earth Sciences. Basic knowledge of R at user level is required to follow the course.
All analyses will be conducted in R. These analyses will use functions from a variety of packages including ape, geiger, phytools, Claddis, dispRity, vegan, momocs, morphospace, and geomorph.
Online live sessions on January 6th, 8th, 13th, and 15th, 2026.
From 13:30 to 17:30 (Madrid time zone).
Total course hours: 22 (16 hours of online live lessons, plus 6 hours of participants working independently with tutored exercises).
This course is equivalent to 1 ECTS (European Credit Transfer System). The recognition of ECTS by other institutions depends on each university or school.
The course will be split evenly between practical sessions and lectures.
Live sessions will be recorded. However, attendance to the live sessions is required to obtain the course certificate.
This course will be delivered in English.

Dr. Thomas Roper-Smith
Oxford University Museum of Natural History
UK


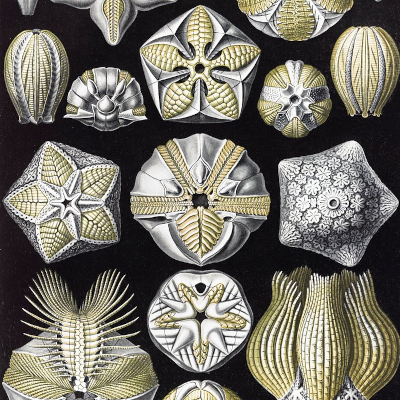 © Ernst Haeckel
 Bouckaert et al. PLoS Comput Biol 15(4): e1006650
 Copyright Oscar Sanisidro